Measuring Current Change
In many ways observation and measurement of change in glaciers and in the ice sheets represent two ends of the spectrum.
There are more than 150,000 individual glaciers on Earth, for some there are almost no measurements, while for others (notably in the European Alps) records of length variations dating back to the 16th and 17th century are among the longest directly observed record of climate system variables available anywhere. Today in situ measurements are made annually on more than one hundred glaciers worldwide and these data provide benchmarks against which models can be tuned or tested (see Projections of Future Change page).
In contrast, there are only two ice sheets on Earth (in Antarctica and Greenland), and measurement of change in these only really began with the advent of satellite imaging in the 1960s and 1970s, and reliable satellite altimeter measurements in the 1990s. These records are thus extremely short and it is thus difficult to determine the degree to which current changes result from natural short-term fluctuations, or longer term progressive trends.
Measuring ice-sheet change.
It has long been realised that ice sheets are dynamic systems in which changes on long and short time-scales could and should be expected. Indeed, for more than half-a-century glaciologists have used in situ observations and airborne photography to identify changes in Antarctica and Greenland. Some of these changes (such as the periodic calving of icebergs) has been attributed to the natural fluctuations of a dynamic ice-sheet system, while others (such as the progressive retreat of ice shelves along the Antarctic Peninsula and in the front of some Greenland glaciers) have been identify as unusual and are most likely responses to long-term climate change. However, while such changes in the horizontal position of the edges of the ice sheets has been possible to measure, for many years, it remained a largely unattained goal of glaciologists to measure changes in the volume or mass of ice sheets, and thus their contribution to sea-level rise.
Arguably, the earliest assessments of mass/volume change across an entire ice sheet began to appear in the late-1990s, as data from the European Space Agency satellites ERS1 and ERS2 began to show consistent patterns of change across Antarctica (Science mag example). Since that time technology, especially satellite technology, has moved forward rapidly. We now have at least four techniques to measure ice-sheet change which are beginning to produce agreement in their quantitative assessments. Two of these techniques will be used by ice2sea researchers to provide a framework of current change in which our model simulations will be evaluated, and direct maps and timeseries of change against which they will be tested.
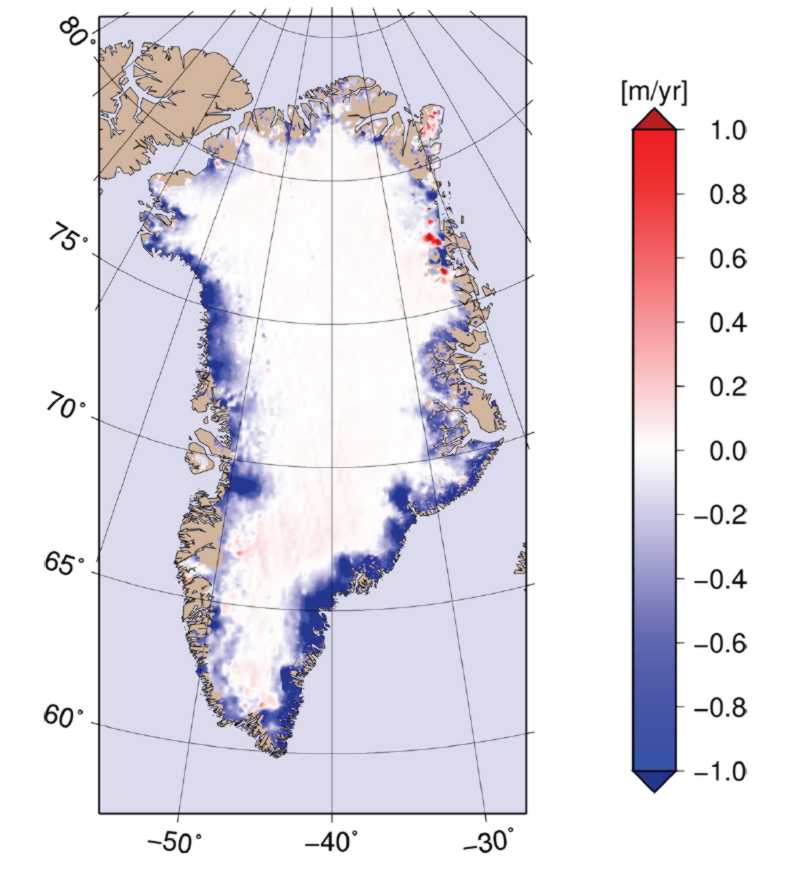
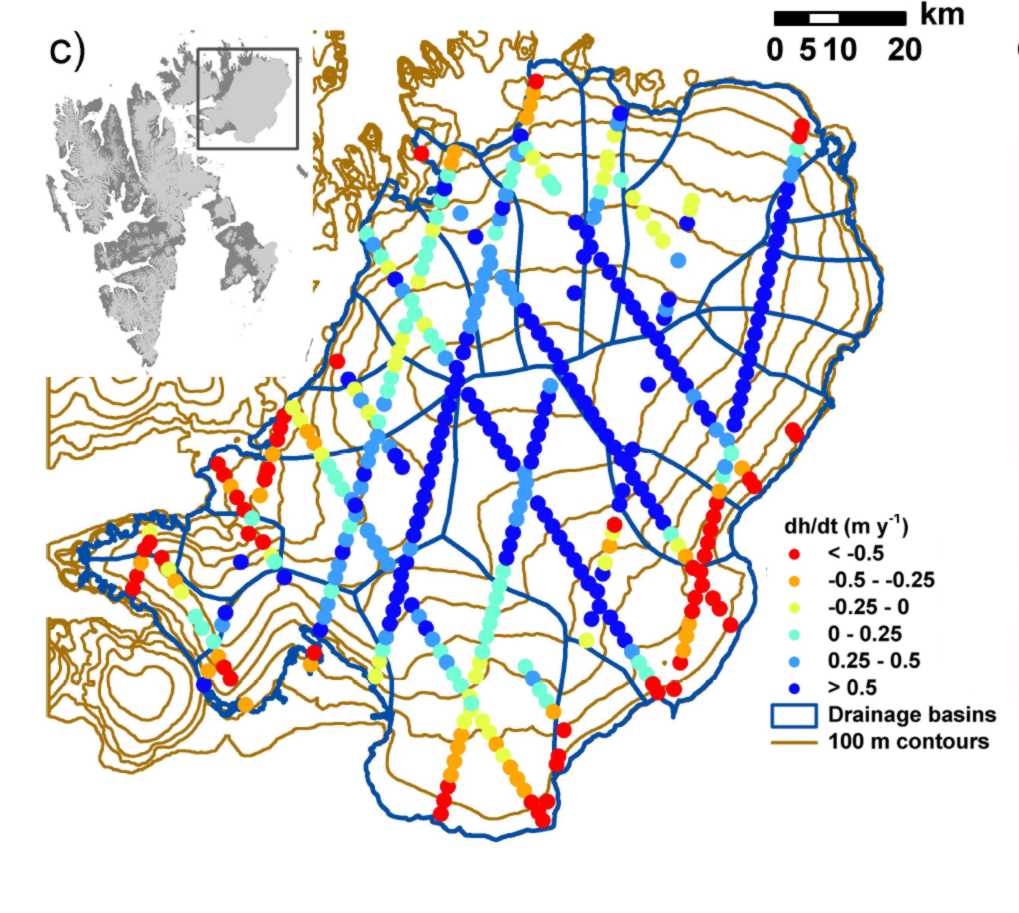
1. Satellite altimetry. An altimeter is an instrument that allow the distance from itself to the surface of the Earth to be measured. Altimeters mounted on satellites, whose positions are tracked with considerable precision, have been used to map the topography of the Earth since the 1970s. However, the precision of these instruments eventually became sufficient to measure changes in the topography over ice sheets. Two flavours of satellite altimetry are now used: radar altimeters, have a rather wide field of view (footprint), and cannot image steep slopes, but are able to observe through cloud cover; and laser altimeters (see figures) which have a narrow field-of-view, and so work on even steep slopes, but are hampered by cloud cover. Satellite altimetry can now give excellent maps of the geographic patterns of change on ice sheets (see example) and the results of both laser and radar altimeters show the glacier basins in Antarctica and Greenland that are losing the most ice.

The spatial distribution of the mass change of the Greenland ice sheet, 2003-08 derived from ICESat data. Reference ice2sea014. Credit Louise Sorensen, DTU.
Ice2sea researchers have used data from various satellite altimeters to prepare data to be used in ensuring our ice-sheet models correctly capture the recent geographic pattern of change in the ice sheets.
2. Satellite gravimetry. NASA’s GRACE satellite mission is an extraordinary innovation that has added enormously to glaciological studies. The mission involves two similar satellites that sit in the same orbit around Earth, with about 200 km between them. Their separation would be constant if it was not for the tiny changes in the Earth’s gravitational field associated with the location of mass (including ice) on and near the surface of the planet. Measurement of the changes in the distance betweeen the satellites as they orbit allows mapping of the gravitation field, and changes in this field as orbits are repeated. The method allows ice sheets to be effectively weighted from space! Although the geographic resolution of this method is not comparable to that available from satellite altimetry, since 2002, the GRACE mission has provided an increasingly coherent record of the time-varying changes in ice-sheet mass and it’s contribution to sea-level rise.
Ice2sea researchers have used data from GRACE satellites prepared by our affiliate partners (example – GFZ-Potsdam) to support testing of our ice-sheet models.
In addition to these techniques, the magnitude and pattern of ice-loss from Antarctica and Greenland has been confirmed by two other independent techniques.
The “accounting” method subtracts observed/modelled snowfall across specific basins within the ice sheet from the measured outflow from the same basin. The imbalance implies a contribution to sea-level rise. In recent years this technique has begun to show value in confirming the more direct satellite techniques described above.
Alternatively, since the Earth’s crust is compressed by the weight of ice in an ice sheet, loss of ice causes the crust to relax and rise. This instantaneous effect is not to be confused with the long-term response to ice-sheet loss known as post-glacial rebound, which is now measurable using state-of-the-art global positioning systems. Its value is that it provides a measurement of ice-sheet change that is independent of the satellite techniques in both Greenland and Antarctica.


